Jun 2, 2022
Editor’s Note: This is an investigative article from Agritecture’s Systems Engineer, Alberto López, on the hidden costs of leafy greens for consumers. Take a look at other investigative posts from López:
Of the 18 to 21 total cups of vegetables that the USDA recommends you eat in a week, at least 1½ to 2 cups should consist of dark leafy greens.
We all know that eating leafy vegetables is vital to a healthy, balanced diet. Greens are packed with nutrition - rich in vitamins A, C, E, and K, alongside containing high levels of fiber, iron, magnesium, potassium, and calcium - all at the cost of minimal carbohydrates, sodium, and cholesterol.
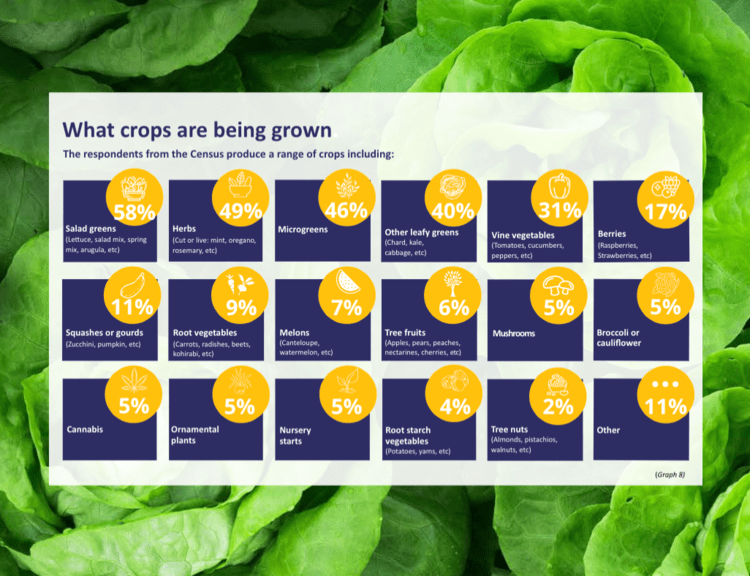
Data from the 2021 Global CEA Census Report showcasing the crops that global census respondents are growing on their CEA farms.
But, what we know very little about is the production side of the equation.
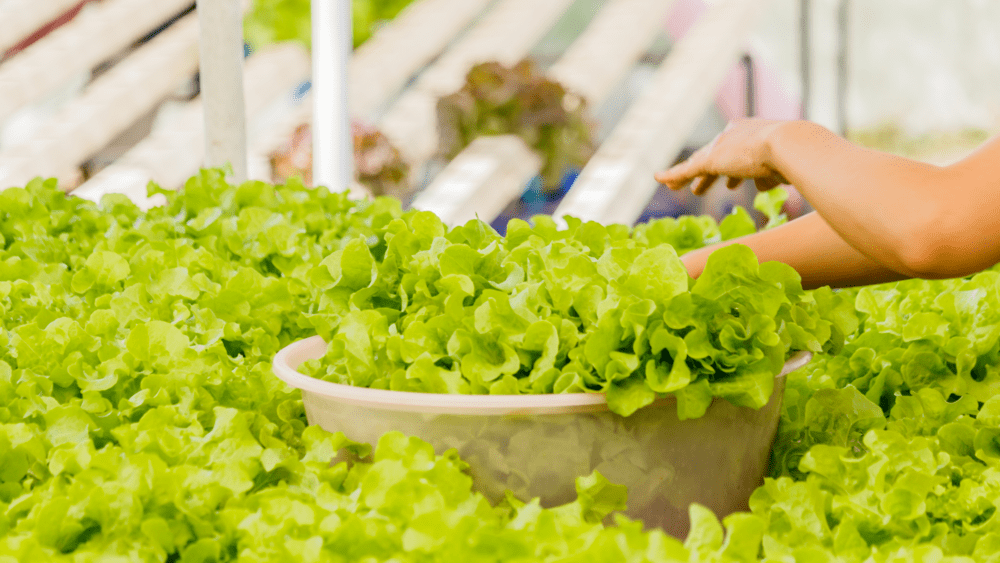
Leafy greens have long dominated the controlled environment agriculture market because of their quick grow cycles and increased yields.
As proof of this, in our 2021 Global CEA Census, we found that the most significant percentage of respondents (CEA growers) grow leafy greens - 58% reported growing salad greens like lettuce and arugula, while 40% reported growing other leafy greens like chard, kale, and cabbage.
Additionally, because of their popularity as a beginner crop, 17% of growers consider growing leafy greens in the next 12 months.
Eden Green’s research indicates that vertical farms produce more than 35x times as many leafy greens as traditional soil-based farms. While traditional farming methods can produce about 40 lbs of lettuce per 100 square feet of planting space, vertical farming can produce ~1500 lbs of leafy greens in the same amount of space based on standard row plantings.
This is because of numerous different reasons:
By stacking vertically, vertical farms increase crop yields by maximizing the production of each acre.
Because leafy greens are considered cold-weather crops, traditional farms can only have one or two harvests of leafy greens a year, while vertical farms can grow 11-13 harvests per year in their climate-controlled environments.
Vertical farms cut down the average grow-cycle of leafy greens to just 28 days.
Agritecture’s research shows that the average yield for CEA-grown leafy greens is in the range of 55 - 65 kg/m2/year, with some companies even reporting up to 80 kg/m2/year.
As our understanding of the interaction of the different factors affecting the crop increases, this average can improve significantly. However, there are still differences in the reported values that can be attributed to how the key metric of "kg/m2/year" is defined.
Problem #1: Unclear definition of “harvestable fresh weight.”
The loose definition of “harvestable fresh weight” permits growers to weigh either the whole plant or just the desired part of the plant when reporting annual yield.
While seemingly unimportant, in the context of leafy greens, the desired part refers to just the leaves. So, a grower could potentially include the weight of the plant’s roots in their “harvestable weight.” This contribution to the “harvestable fresh weight” can easily hike up prices of leafy greens for consumers due to estimating more weight.
Additionally, the length of the stem in some varieties of greens contributes significantly to the total leaf weight. And, as a result, a leaf harvested closer to the roots would contribute more to the cumulative weight than one with a shorter stem.
There is also a case to be made about a production that includes double-cut produce to decrease cycles. This is because washing the greens may alter it to carry more water weight than greens that are not washed.
Problem #2: It’s difficult to compare effective planting surfaces and production systems.
Here, one of the key benefits of indoor farming is brought to light: increased crop yields through the maximization of the production of each acre of space.
However, different grow systems can be optimized to modify the plant density for the relevant stages of the plant’s grow cycle. Some systems also have the planting surface perpendicular to the floor area i.e. tower gardens and zipgrow towers.
Additionally, in some systems, the crops cover the entire surface of the growing area, and based on the size of the tray, the pipe and drain use only a small percentage of the total area. This affects the fresh weight per unit of area in comparison to systems using distributed holes or plant sites. This is relevant because if several seeds are grown per spot for the entire cycle, it will alter the true planting density of the crop.
Here, we need to question how growers allocate the borders of their racking systems - as part of the growing surface or as part of unused aisle space?
Problem #3: Unclear industry standard for grow cycles.
Some producers define the growing cycle as the time the crop spends on the main grow system, while others consider the stages prior to this i.e. seeding, germination, and propagation.
This definition is important to understand system allocation and sizing, but does not represent the total plant development time.
It often causes a 2 - 14 day difference in the yearly calculation of a grower’s yield, considering the production cycle from seed to harvest.
These unclear definitions result in inaccurate pricing for consumers. Establishing clearer metrics will enable more trustworthiness in such benchmarking data.
At a global level, much excitement and investment continue to flow into the vertical farming industry. It is a fact that vertical farming is still relatively nascent and thus maintains a certain level of risk and uncertainty for the industry stakeholders.
Having reliable and comparable data about the industry enables the continuous improvement of processes for a more efficient production - including but not limited to the assessment of the most suitable business model for your specific project, identification of industry pitfalls, and solidification of a company’s objectives.
At the same time, it provides a way to educate future investors and consumers while managing their expectations, resulting in a general improvement of the entire industry.
Increasing industry-wide transparency and access to data is precisely the reason why
Agritecture & WayBeyond partnered to bring you the 2021 Global CEA Census Report!
About The Author